
Belrise Industries Rated “Buy” by LKP Research; Target Price ₹192
Mumbai, September 25, 2025 — LKP Research has initiated coverage on Belrise Industries Limited, assigning a “Buy” rating and setting a target price of ₹192. The brokerage expects the company to benefit from strategic tie-ups with original equipment manufacturers (OEMs) and a series of new products aimed at improving its value proposition in the two-wheeler and four-wheeler segments.
Belrise, headquartered in Pune, remains primarily focused on the two-wheeler auto ancillary segment but has been expanding into four-wheelers, which accounted for 9% of revenue in FY25. LKP projects this share could grow to 12–13% by FY28, driven by acquisitions and partnerships with leading Japanese OEMs. This expansion is expected to enhance the company’s craftsmanship-per-value (CPV) metrics and support a potential stock re-rating.
Financial projections in the LKP report suggest a ~34% CAGR in Profit After Tax (PAT) between FY25 and FY28, underpinned by a 13% EBITDA CAGR and the positive impact of de-leveraging. The brokerage also highlights that simplification of the corporate structure and potential scaling down of low-margin trading operations could unlock additional shareholder value.
Key Highlights:
- Two-Wheeler Business: Core revenue driver, benefiting from premiumization initiatives.
- Four-Wheeler Segment: Expected to grow rapidly with strategic OEM partnerships.
- Financial Outlook: PAT CAGR ~34% and EBITDA CAGR 13% (FY25–FY28).
- Corporate Strategy: Simplification of group structure may add value.
1. Revenue Split FY25 (Pie Chart)
Two-Wheelers: 91%
Four-Wheelers: 9%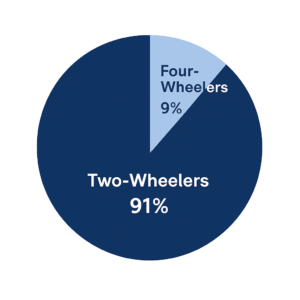
2. Projected Revenue Share FY28 (Bar Chart)
Segment           FY28 Revenue %
Two-Wheelers       87%
Four-Wheelers      13%
FY28 Revenue by Segment
| Segment | Revenue % | Visual |
|---|---|---|
| Two-Wheelers | 87% | |
| Four-Wheelers | 13% |
3. PAT & EBITDA Growth FY25–FY28 (Line Chart)
Year   PAT (₹ Cr)   EBITDA (₹ Cr)
FY25     50           80
FY26     67           90
FY27     85           102
FY28 110 115Company Performance: PAT & EBITDA (₹ Cr)
Disclaimer: The information provided in this article is for informational and educational purposes only and should not be considered as financial or investment advice. Readers are advised to conduct their own research or consult with a qualified financial advisor before making any investment decisions. Catchy Capital or its affiliates do not take responsibility for any gains or losses incurred based on the information provided.