
Marubozu Candlestick Pattern: Meaning, Types and How to Trade: Candlestick patterns are one of the most widely used tools in technical analysis. They not only depict price action but also reflect market psychology, helping traders predict future trends. Among these patterns, the Marubozu candlestick pattern stands out for its simplicity and reliability in indicating strong market sentiment.
Whether you are a beginner or an experienced trader, understanding Marubozu can give you a significant edge in identifying potential breakouts and trend continuations. In this article, we will cover everything you need to know about the Marubozu candlestick pattern — its meaning, types, psychology, variations, and how to trade it effectively.
What is a Marubozu Candlestick Pattern?
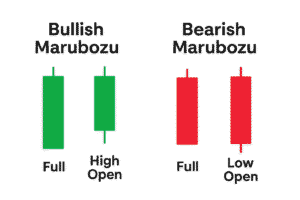
The term “Marubozu” comes from Japanese, meaning “bald” or “shaven head.” In candlestick charts, a Marubozu is a candlestick without upper or lower shadows (wicks). It has a full body, indicating strong price momentum in one direction.
- A Bullish Marubozu forms when the opening price is the lowest of the session and the closing price is the highest. It shows buyers dominated the market throughout the trading period.
- A Bearish Marubozu forms when the opening price is the highest and the closing price is the lowest. It shows sellers had complete control.
In short, a Marubozu signals strong conviction from either buyers or sellers.
Key Characteristics of Marubozu Candlestick
- No shadows (or very small shadows): The candlestick has no wicks, making it look “bald.”
- Full body: The entire candle represents price movement in one direction.
- Represents dominance: Either buyers (bullish) or sellers (bearish) control the market.
- Timeframe matters: Marubozu patterns can appear in intraday, daily, weekly, or monthly charts. Longer timeframes generally give stronger signals.
Types of Marubozu Candlestick Patterns
There are mainly two types of Marubozu candlesticks:
1. Bullish Marubozu
- Appearance: A long green (or white) candlestick with no shadows.
- Psychology: Buyers are in complete control from the opening bell to the close.
- Implication: Indicates strong bullish momentum and possible continuation of an uptrend.
- Example: If a stock opens at ₹500 and closes at ₹540 without any pullback, it forms a bullish Marubozu.
2. Bearish Marubozu
- Appearance: A long red (or black) candlestick without shadows.
- Psychology: Sellers dominate the market, pushing the price down from open to close.
- Implication: Signals strong bearish momentum and potential continuation of a downtrend.
- Example: If a stock opens at ₹540 and closes at ₹500 without upward movement, it forms a bearish Marubozu.
- Difference Between Futures and Options in the Stock Market
 Learn the key differences between futures and options in the stock market. Understand how each works, their risks, benefits, and which suits your trading goals.
 - What Are Derivatives? A Beginner’s Guide to Futures and Options
 Introduction: Understanding the Power of Derivatives In the world of financial markets, derivatives are often viewed as complex instruments meant only for advanced traders. Yet, if understood properly, they can…
 - Nifty Prediction for 10 October 2025: Bullish Momentum Likely to Continue
 Nifty 50 Prediction; closed at 25,181 with strong buying near 25,000. Outlook for 10 Oct 2025 remains bullish with support at 25,000 and resistance near 25,350.
 - Nifty 50 Prediction For 9 October 2025: A Technical and Data Driven AnalysisNifty closed at 25,046 with high volatility. Key support at 25,000, resistance near 25,200. Read full prediction for 9 October 2025 trading session.
- MACD Indicator: A Complete Guide For Beginners
 Learn MACD- Moving Average indicator basics, calculation, signals, and trading strategies. A complete beginner’s guide to using MACD in stock market trading.
Variations of Marubozu
Although the classic Marubozu has no shadows, in real-world markets, small wicks may appear. Traders generally accept them as valid Marubozu patterns if shadows are negligible. Variations include:
- Opening Marubozu: Candlestick opens at the day’s high (bullish) or low (bearish) but may have a small shadow on the closing side.
- Closing Marubozu: Candlestick closes at the day’s high (bullish) or low (bearish) but may have a small shadow at the opening side.
These variations still represent strong momentum but with minor intraday fluctuations.
Psychology Behind the Marubozu
Candlestick patterns are powerful because they reflect market psychology. Let’s break down what happens behind each type:
- Bullish Marubozu: Buyers aggressively enter the market from the start, with no resistance from sellers. It shows confidence, optimism, and strong demand.
- Bearish Marubozu: Sellers dominate, and buyers show little interest. It reflects fear, pessimism, and strong supply pressure.
This clear imbalance of power makes the Marubozu a strong continuation or reversal indicator, depending on context.
Significance of Marubozu in Technical Analysis
- Trend Confirmation: If a bullish Marubozu appears during an uptrend, it confirms strong buyer interest. Similarly, a bearish Marubozu in a downtrend validates selling pressure.
- Trend Reversal Signal: When Marubozu appears after prolonged consolidation, it can signal the start of a new trend.
- Breakout Indicator: Often, Marubozu appears during major breakouts above resistance or below support.
- Psychological Strength: It reflects one-sided dominance in the market, reducing uncertainty.
How to Trade Using Marubozu Candlestick Pattern
Trading Marubozu requires context. A single candlestick should not be taken as a trading signal; it must be analyzed with trend, support/resistance, and volume.
Here’s a step-by-step trading guide:
1. Identify Market Trend
- If the market is already in an uptrend and a bullish Marubozu appears, it signals trend continuation.
- If the market is in a downtrend and a bearish Marubozu appears, it confirms further weakness.
2. Look for Key Support and Resistance Levels
- A bullish Marubozu breaking above resistance is a strong buy signal.
- A bearish Marubozu breaking below support is a strong sell signal.
3. Confirm with Volume
- High volume with Marubozu means the signal is more reliable.
- Low volume Marubozu may be a false signal.
4. Entry and Exit Strategy
- Bullish Marubozu Entry: Enter long trade at the close or on a minor pullback.
- Bearish Marubozu Entry: Enter short trade at the close or on a minor retracement.
- Stop Loss: Place stop loss below the bullish Marubozu’s low or above the bearish Marubozu’s high.
- Targets: Use support/resistance, Fibonacci retracement, or moving averages to set targets.
Practical Examples
Example 1: Bullish Marubozu in Uptrend
- Stock XYZ trades at ₹200.
- A bullish Marubozu forms, opening at ₹200 and closing at ₹220.
- Volume is high, and resistance was at ₹215.
- Interpretation: Breakout above resistance with strong buying = bullish continuation.
Example 2: Bearish Marubozu in Downtrend
- Stock ABC trades at ₹350.
- A bearish Marubozu forms, opening at ₹350 and closing at ₹320.
- Volume is strong, and support at ₹325 was broken.
- Interpretation: Breakdown below support = bearish continuation.
Advantages of Trading with Marubozu
- Clear and easy to spot.
- Strong signal of market sentiment.
- Helps confirm trend direction.
- Useful in identifying breakout and breakdown points.
Limitations of Marubozu
- Rare occurrence: Pure Marubozu is not very frequent.
- Needs confirmation: A single candle should not be the sole basis for trades.
- False signals: Can be misleading in low-volume or sideways markets.
- Works best with other tools: Combine with moving averages, RSI, MACD, or support/resistance for accuracy.
Tips for Trading Marubozu Candlesticks
- Always check the broader market trend before acting.
- Use multiple timeframes for confirmation.
- Look for volume spikes for reliability.
- Avoid trading solely on Marubozu during low-volatility markets.
- Combine with other candlestick patterns (Doji, Engulfing, Hammer) for stronger signals.
Difference Between Marubozu and Other Candlestick Patterns
| Pattern | Key Feature | Market Psychology | Reliability |
|---|---|---|---|
| Marubozu | Full body, no shadows | Complete dominance by buyers/sellers | High |
| Doji | No body, equal open & close | Market indecision | Moderate |
| Hammer | Small body, long lower wick | Reversal after selling pressure | Moderate |
| Engulfing | Larger candle engulfs previous | Strong reversal potential | High |
This comparison shows why Marubozu is considered a decisive candlestick.
Conclusion
The Marubozu candlestick pattern is one of the most powerful indicators in technical analysis. Its clear, shadowless body represents strong market conviction — either bullish or bearish. When used in the right context, Marubozu can help traders:
- Confirm trends
- Spot breakouts and breakdowns
- Identify strong entry and exit points
However, traders should not rely solely on Marubozu. Combining it with trend analysis, volume confirmation, and other technical indicators increases accuracy.
For beginners, the Marubozu is an excellent starting point to understand candlestick psychology and momentum trading. For advanced traders, it can serve as a powerful confirmation tool in trend-following strategies.
In the fast-paced world of trading, recognizing a Marubozu candlestick can make the difference between catching a trend early or missing a profitable opportunity.