In stock market trading, technical indicators play a crucial role in identifying profitable opportunities. One of the most widely used and beginner-friendly indicators is the Relative Strength Index (RSI). The RSI trading strategy helps traders decide when to enter or exit trades by analyzing momentum and price strength.
If you are new to trading, this guide will explain everything about RSI trading strategy in simple words.
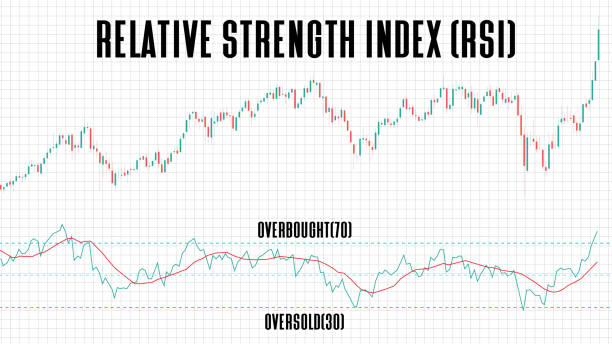
What is RSI (Relative Strength Index)?
RSI is a momentum oscillator developed by J. Welles Wilder. It measures the speed and change of price movements on a scale of 0 to 100.
- Above 70 → Overbought zone (price may fall).
- Below 30 → Oversold zone (price may rise).
- Between 30–70 → Neutral zone (no strong trend).
RSI helps traders identify whether a stock is overvalued or undervalued, thus signaling potential buy or sell opportunities.
How is RSI Calculated?
The formula for RSI is:
RSI = 100 – [100 / (1 + RS)]
Where RS (Relative Strength) = Average Gain ÷ Average Loss (over a given period, usually 14 days).
Most trading platforms calculate RSI automatically, so traders don’t need to do manual calculations.
Key RSI Levels and Their Meaning
- RSI above 70 → Indicates overbought conditions (possible trend reversal or pullback).
- RSI below 30 → Indicates oversold conditions (possible bounce or reversal).
- RSI between 40–60 → Sideways or range-bound market.
- RSI crossing 50 → Often considered a trend confirmation signal.
Popular RSI Trading Strategies
1. RSI Overbought and Oversold Strategy
- Buy Signal: When RSI goes below 30 and starts moving upward.
- Sell Signal: When RSI goes above 70 and starts moving downward.
- Best for: Beginners looking for simple entry and exit points.
2. RSI Divergence Strategy
- Bullish Divergence: Price makes a new low, but RSI makes a higher low → signals potential upside.
- Bearish Divergence: Price makes a new high, but RSI makes a lower high → signals possible downside.
3. RSI Swing Rejection Strategy
- Bullish Rejection: RSI falls below 30, rises above it, pulls back but stays above 30, then rises again → strong buy signal.
- Bearish Rejection: RSI goes above 70, falls below it, retraces but stays below 70, then drops again → strong sell signal.
- Best Swing Trading Strategies for Indian Stock Markets
- How to Learn Price Action Trading: A Complete Beginner’s Guide
4. RSI with Moving Averages
- Combine RSI with 50-day or 200-day moving averages for better accuracy.
- Example: If RSI shows oversold but the stock is above its 200-day average, the probability of reversal increases.

Pros of RSI Trading Strategy
- Simple and beginner-friendly.
- Works across stocks, forex, commodities, and crypto.
- Helps spot early trend reversals.
- Can be combined with other indicators for accuracy.
Limitations of RSI
- May give false signals during strong trends.
- Works better in range-bound markets than in highly trending markets.
- Should not be used alone—confirmation with other indicators is recommended.
Common Mistakes Beginners Make with RSI
- Relying only on RSI without checking price action or support-resistance.
- Ignoring strong trends (RSI can stay overbought/oversold for a long time).
- Overtrading based on every RSI signal.
- Not using stop-loss while trading.
- Read More:
Best Settings for RSI
- Default Period: 14 days (most commonly used).
- Short-term Traders: 9-day RSI for faster signals.
- Long-term Traders: 21-day RSI for smoother signals.
Final Thoughts
The RSI trading strategy is one of the easiest and most effective tools for beginners in the stock market. It helps identify potential entry and exit points by showing overbought and oversold conditions. However, it should not be used in isolation. Always confirm with price action, support-resistance, or other indicators before making a decision.
With discipline, practice, and risk management, RSI can be a powerful addition to your trading toolkit.