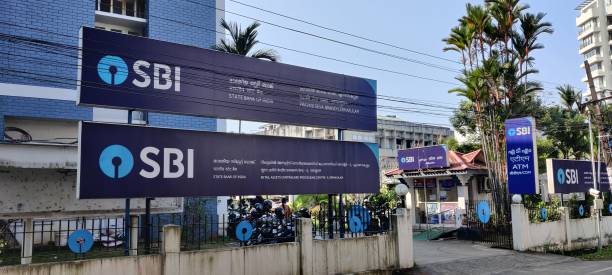
State Bank of India (SBI) — In-Depth Financial & Strategic Profile
1. Snapshot & Key Metrics
| Metric | Value |
|---|---|
| Share Price (as of Sep 26, 2025) | ₹ 857 |
| Market Capitalization | ₹ 7,91,110 crore |
| Price / Earnings (P/E) | 9.96 |
| Book Value | ₹ 583 per share |
| Dividend Yield | 1.86 % |
| Return on Capital Employed (ROCE) | 6.47 % |
| Return on Equity (ROE) | 17.2 % |
| Face Value of Share | ₹ 1.00 |
Key Strengths
- 36.3 % CAGR in profit over the past 5 years
- Consistent dividend payout (~18.2 %)
Cautions / Risks
- Low interest coverage ratio
- High contingent liabilities (~ ₹ 27.42 lakh crore)
- Significant contribution from “Other Income” (~ ₹ 1.79 lakh crore)
2. Growth & Trends (5- and 10-Year Trajectory)
Revenue & Profit Growth
- 10-year compound sales growth: ~ 9 %
- 5-year compound profit growth: ~ 36 %
- 3-year profit growth: ~ 30 %
Share Price Returns
- 10-year CAGR: ~ 13 %
- 5-year CAGR: ~ 36 %
- 3-year CAGR: ~ 17 %
- 1-year return: ~ 7 %
SBI has delivered both business expansion and long-term shareholder value.
3. Quarterly Trends & Operational Dynamics
- Interest Income: Rising steadily (~ ₹ 78,000 crore in recent quarters).
- Operating Expenses: Climbing, adding pressure on net interest margins.
- Financing Margin: Sometimes negative (–10 % to –20 % in certain quarters).
- Other Income: Plays a large role in profit stability.
- Net Profit: Upward trend, with taxes in the 25–27 % range.
- Asset Quality:
- Gross NPA down to ~ 2.13 %
- Net NPA down to ~ 0.52 %
Despite cost pressures, SBI has maintained profitability while keeping NPAs under control.
4. Balance Sheet & Financial Position
Funding Sources (Liabilities):
- Deposits: ₹ 5.43 lakh crore+
- Borrowings: ₹ 6.10 lakh crore
- Total Liabilities: ₹ 7.31 lakh crore
Asset Deployment:
- Investments: ₹ 22.05 lakh crore
- Other Assets (Advances, Receivables, etc.): ₹ 50.60 lakh crore
- Fixed Assets & Infrastructure: Growing steadily
Equity & Reserves:
- Equity Capital: ₹ 892 crore
- Reserves: ₹ 4.86 lakh crore
SBI’s strong reserves and deposit base provide stability and expansion capacity.
5. Cash Flow Behavior
- Operating Cash Flow: Volatile —
- FY22: +₹ 57,695 crore
- FY23: –₹ 86,014 crore
- FY24: +₹ 21,632 crore
- FY25: +₹ 48,486 crore
- Investing Activities: Regular outflows for asset and investment expansion.
- Financing Activities: Balanced borrowings and repayments depending on funding cycles.
Cash flow swings are natural for a banking giant due to deposit and lending cycles.
6. Shareholding Pattern
| Shareholder Type | Holding % |
|---|---|
| Government / Promoter | ~ 55.50 % |
| Foreign Institutional Investors (FIIs) | ~ 9.98 % |
| Domestic Institutional Investors (DIIs) | ~ 27.08 % |
| Public / Retail | ~ 7.30 % |
Insight: Government retains majority control, while institutional investors (domestic + foreign) play a significant role in ownership.
7. Strategic Insights
- Scale & Reach: India’s largest bank with unmatched penetration.
- Growth Drivers: Expanding deposit base, lending portfolio, and investments.
- Profitability Mix: Relies on both interest income and strong “other income” contributions.
- Challenges: Margin pressures and high contingent liabilities.
- Resilience: Strong reserves, improving NPA ratios, and consistent investor engagement.
Conclusion
- State Bank of India remains a pillar of India’s financial ecosystem, combining:
- Historic legacy and government backing
- Massive market share in deposits and advances
- Strong profitability growth and consistent dividend history
Even with challenges in financing margins and liability management, SBI’s leadership, resilience, and long-term value creation continue to make it one of India’s most attractive banking institutions.
⚠️ Disclaimer: This article is for informational and educational purposes only. It does not constitute financial or investment advice. Investors should consult licensed advisors before making investment decisions.


